
Price transparency data is one of the most powerful tools to emerge in healthcare in recent years. It also, like so many aspects of healthcare, is full of nuance.
We have seen plenty of examples where analysts pull numbers from machine-readable files, find a striking difference between two organizations, and publish a conclusion that falls apart the moment someone with real contracting experience looks at the methodology. The challenge, in most of those cases, is not the data as much as it’s the approach.
Through hundreds of customer interactions, we’ve been able to see how experts are using this data everyday. In this post, we take some of these learnings and attempt to lay out a framework from all these interactions that you can use when benchmarking reimbursement between hospitals or healthcare organizations.
Start with Strategy, Not Data
Before you open a single file or run a single query, start with answering a fundamental question: what are you actually trying to accomplish?
Are you a managed care leader preparing for contract renegotiation with a specific payer? Are you a consultant helping a health system understand where they are underpaid relative to peers? Are you an employer trying to steer members to higher-value providers?
The answer shapes everything: which codes to analyze, which data sources to prioritize, how to normalize comparisons, and what conclusions you can reasonably draw.
Too often, analysts dive into the data without a clear strategy. They pull a huge portion of the data, see interesting-looking numbers, find surprising variations, and draw conclusions that may not be relevant at all.
Understand That Rates Are as Unique as Contracts
This may be the most foundational truth around price transparency: every negotiated rate reflects a unique relationship between a specific payer, a specific plan, and a specific provider. Decades of legal back-and-forth, mergers and acquisitions, strategy shifts, policy changes and necessary responses all add up to data reflected in MRFs that attempt to codify & represent all of that complexity.
Two hospitals in the same city, with the same payer mix, serving similar patient populations, can have wildly different reimbursement structures. One might have percent-of-charge contracts. The other might have fee schedules. One might have carved out high-cost drugs and implants. The other might have bundled case rates for certain service lines.
This means you cannot simply pull two numbers from two machine-readable files and declare a winner. You have to understand the underlying contract structures and details around services to make any meaningful comparison.
Use the Right Data Sources
Accurate reimbursement analysis requires triangulating multiple data sources. No single source tells the complete story, and each one plays a distinct role in building a reliable picture.
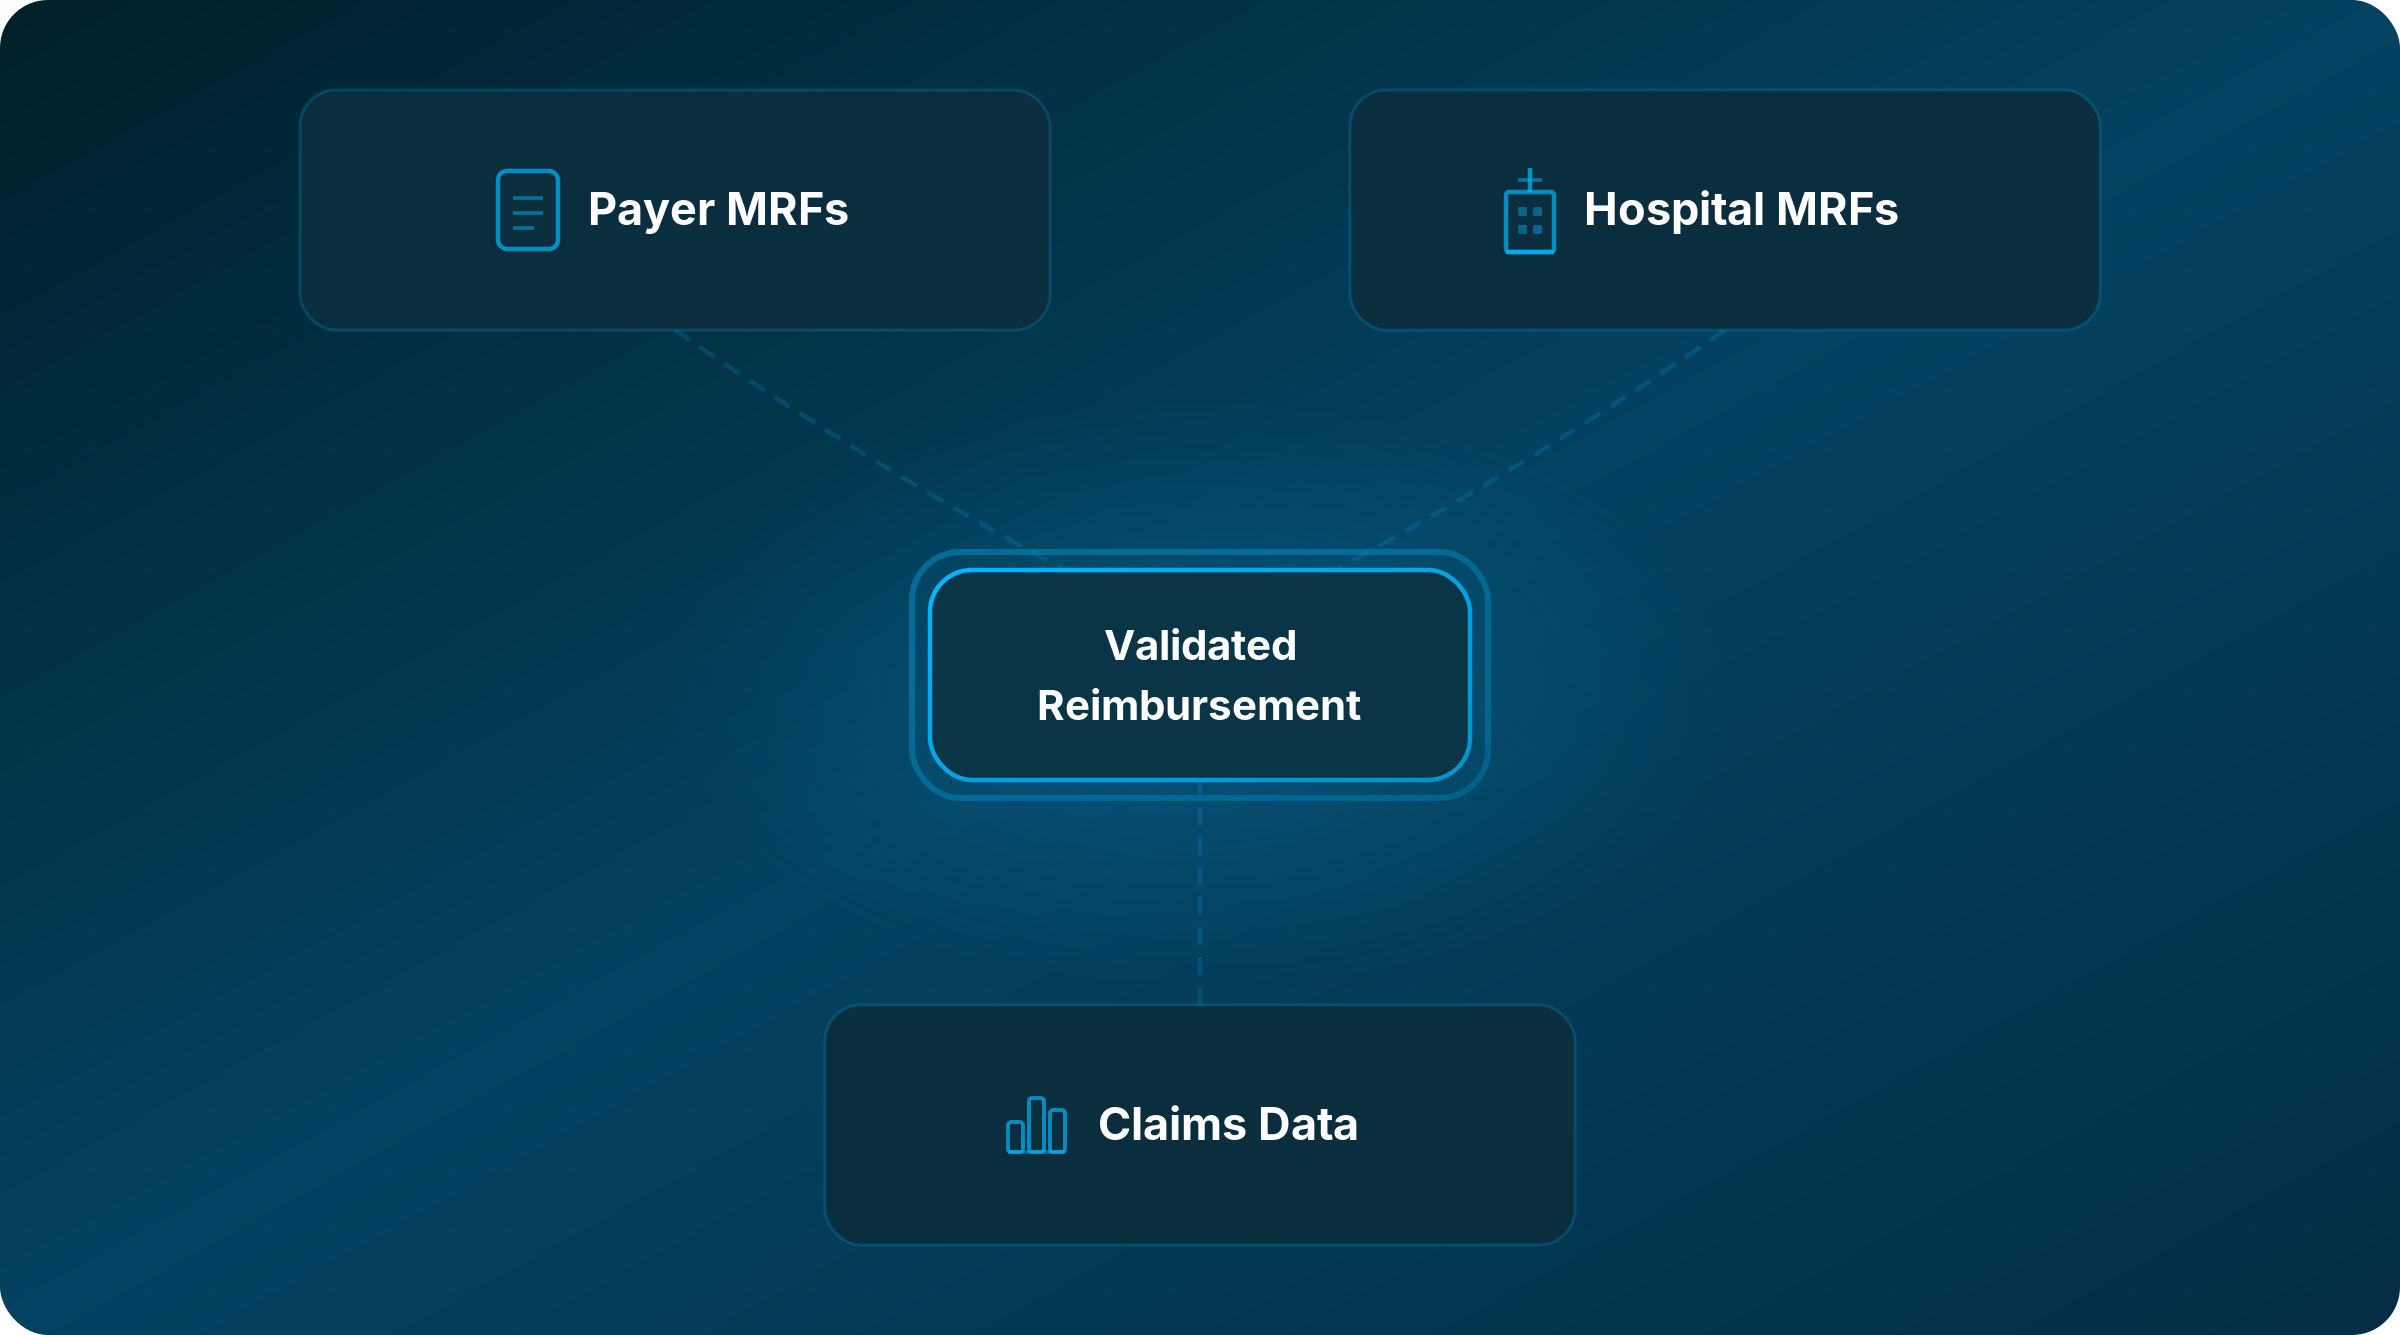
Payer Machine-Readable Files (Transparency in Coverage)
These files, published by commercial carriers as required by federal regulation, contain negotiated rates for in-network providers by plan type. They are the closest thing we have to ground truth for what a payer has contractually agreed to pay, and it is worth saying plainly: payers are required by law to publish accurate, complete data in these files. Enforcement of that requirement matters. When the files are done right, they are an incredibly powerful starting point.
Working with these files in practice comes with real challenges. File sizes can run into multiple terabytes with hundreds of millions of rows. Access links expire. APIs rate-throttle. Data can be duplicated across plan types in ways that require careful handling before any comparison is meaningful. That is part of why triangulating with the other two sources is essential, not optional.
Hospital Machine-Readable Files (Hospital Price Transparency)
Hospitals publish their own pricing files and are required to affirm the accuracy and completeness of their MRFs as of July 1, 2024. These files include standard charges, payer-specific negotiated rates, and estimated reimbursement amounts.
We treat hospital MRF data as a useful supplemental reference, particularly for cross-checking, but not as a primary benchmarking source. The estimated amounts can be unreliable, especially for complex contract structures. It is a piece of the puzzle, not the foundation of the analysis.
Claims Data
Contracted rates are one thing, but real-world claims and utilization unlocks more precise benchmarking and cohort analysis, helps you understand potential revenue impacts of higher reimbursements, and can be a useful tool in interrogating where contracts live within complex organizational structures. Claims data shows what actually happened: what was billed, what was paid, and how consistently. Remittance data (specifically the 835 files) reveals actual reimbursement amounts across countless observed transactions.
This also becomes essential when you are working with percent-of-charge contracts. The payer MRF gives you the rate as a percentage, claims data tells you what the hospital typically charges, and together they let you calculate an estimated reimbursement, which you can then validate against observed remittances (if available). That triangulation can be powerful. The organizations doing this work are using all three sources together, cross-referencing and validating rather than relying on any one of them alone.
Build Bundles, Not Single-Code Comparisons
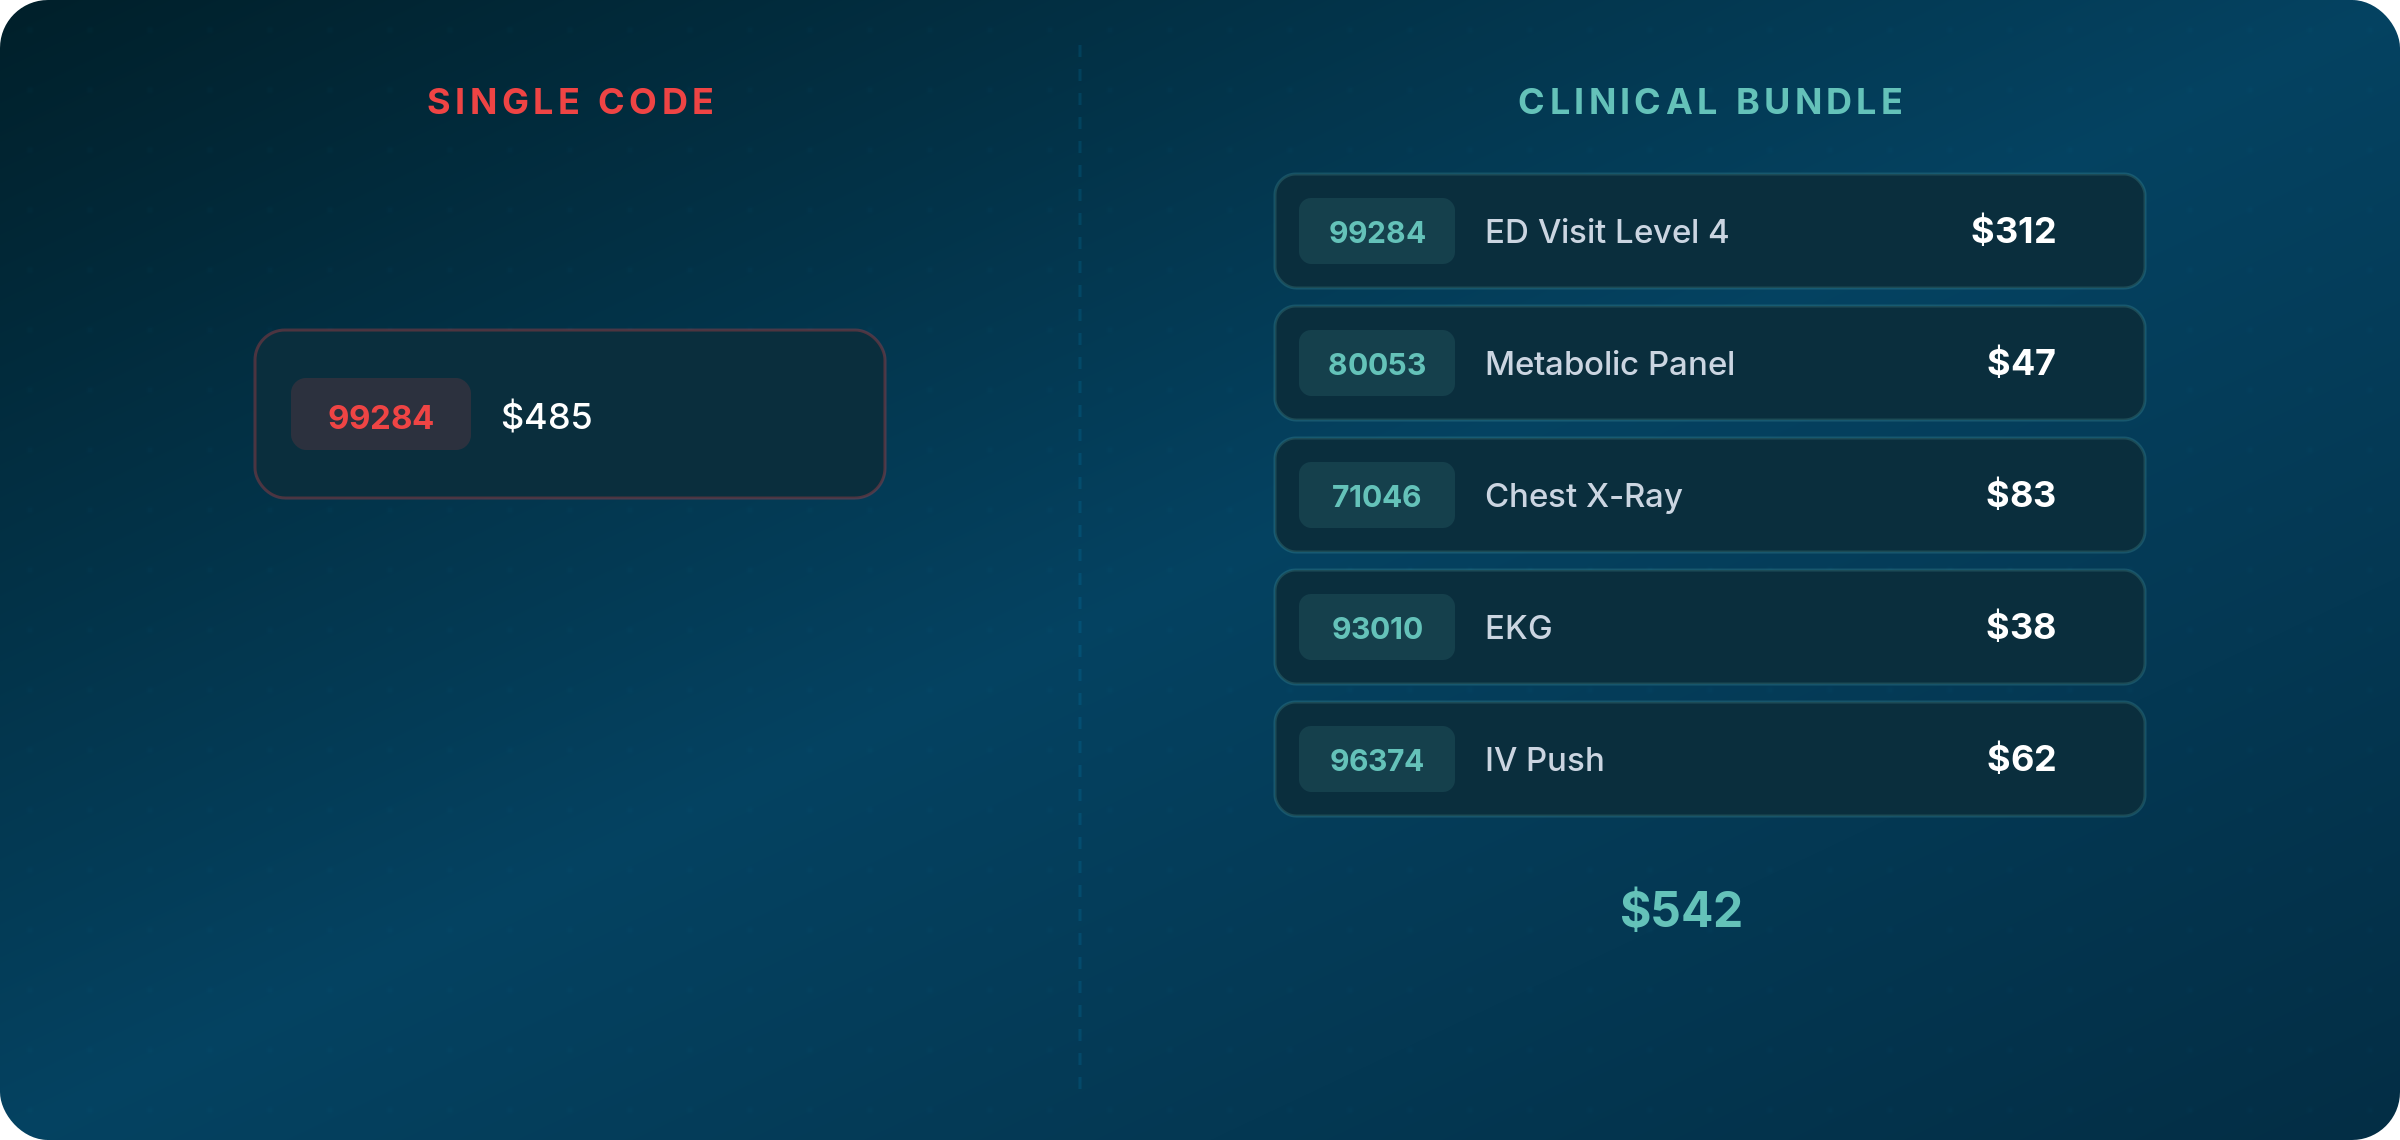
A hospital visit is rarely a single billing code. An emergency visit regularly includes the evaluation and management code, labs, imaging, cardiac diagnostics, IV services, and potentially dozens of other line items depending on how the patient presents. A knee surgery includes the procedure code, anesthesia, implants, facility fees, and post-operative care. An infusion visit includes the drug, administration codes, and nursing time.
Comparing a single code between two organizations tells you very little about total reimbursement for that episode of care. Remember to always build clinically appropriate bundles that reflect how services are actually delivered and billed. Define the full picture before you touch any data.
Account for Professional and Facility Components
Many services generate both a professional component (the physician’s work) and a facility component (the hospital’s resources). These might appear on separate claims forms, can be negotiated separately, and can vary independently from one organization to another as well as from service to service.
Any analysis that only captures one component is going to be off. And because different organizations structure their billing differently, understanding how each organization actually bills is a big part of the effort.
Normalize for Different Reimbursement Structures
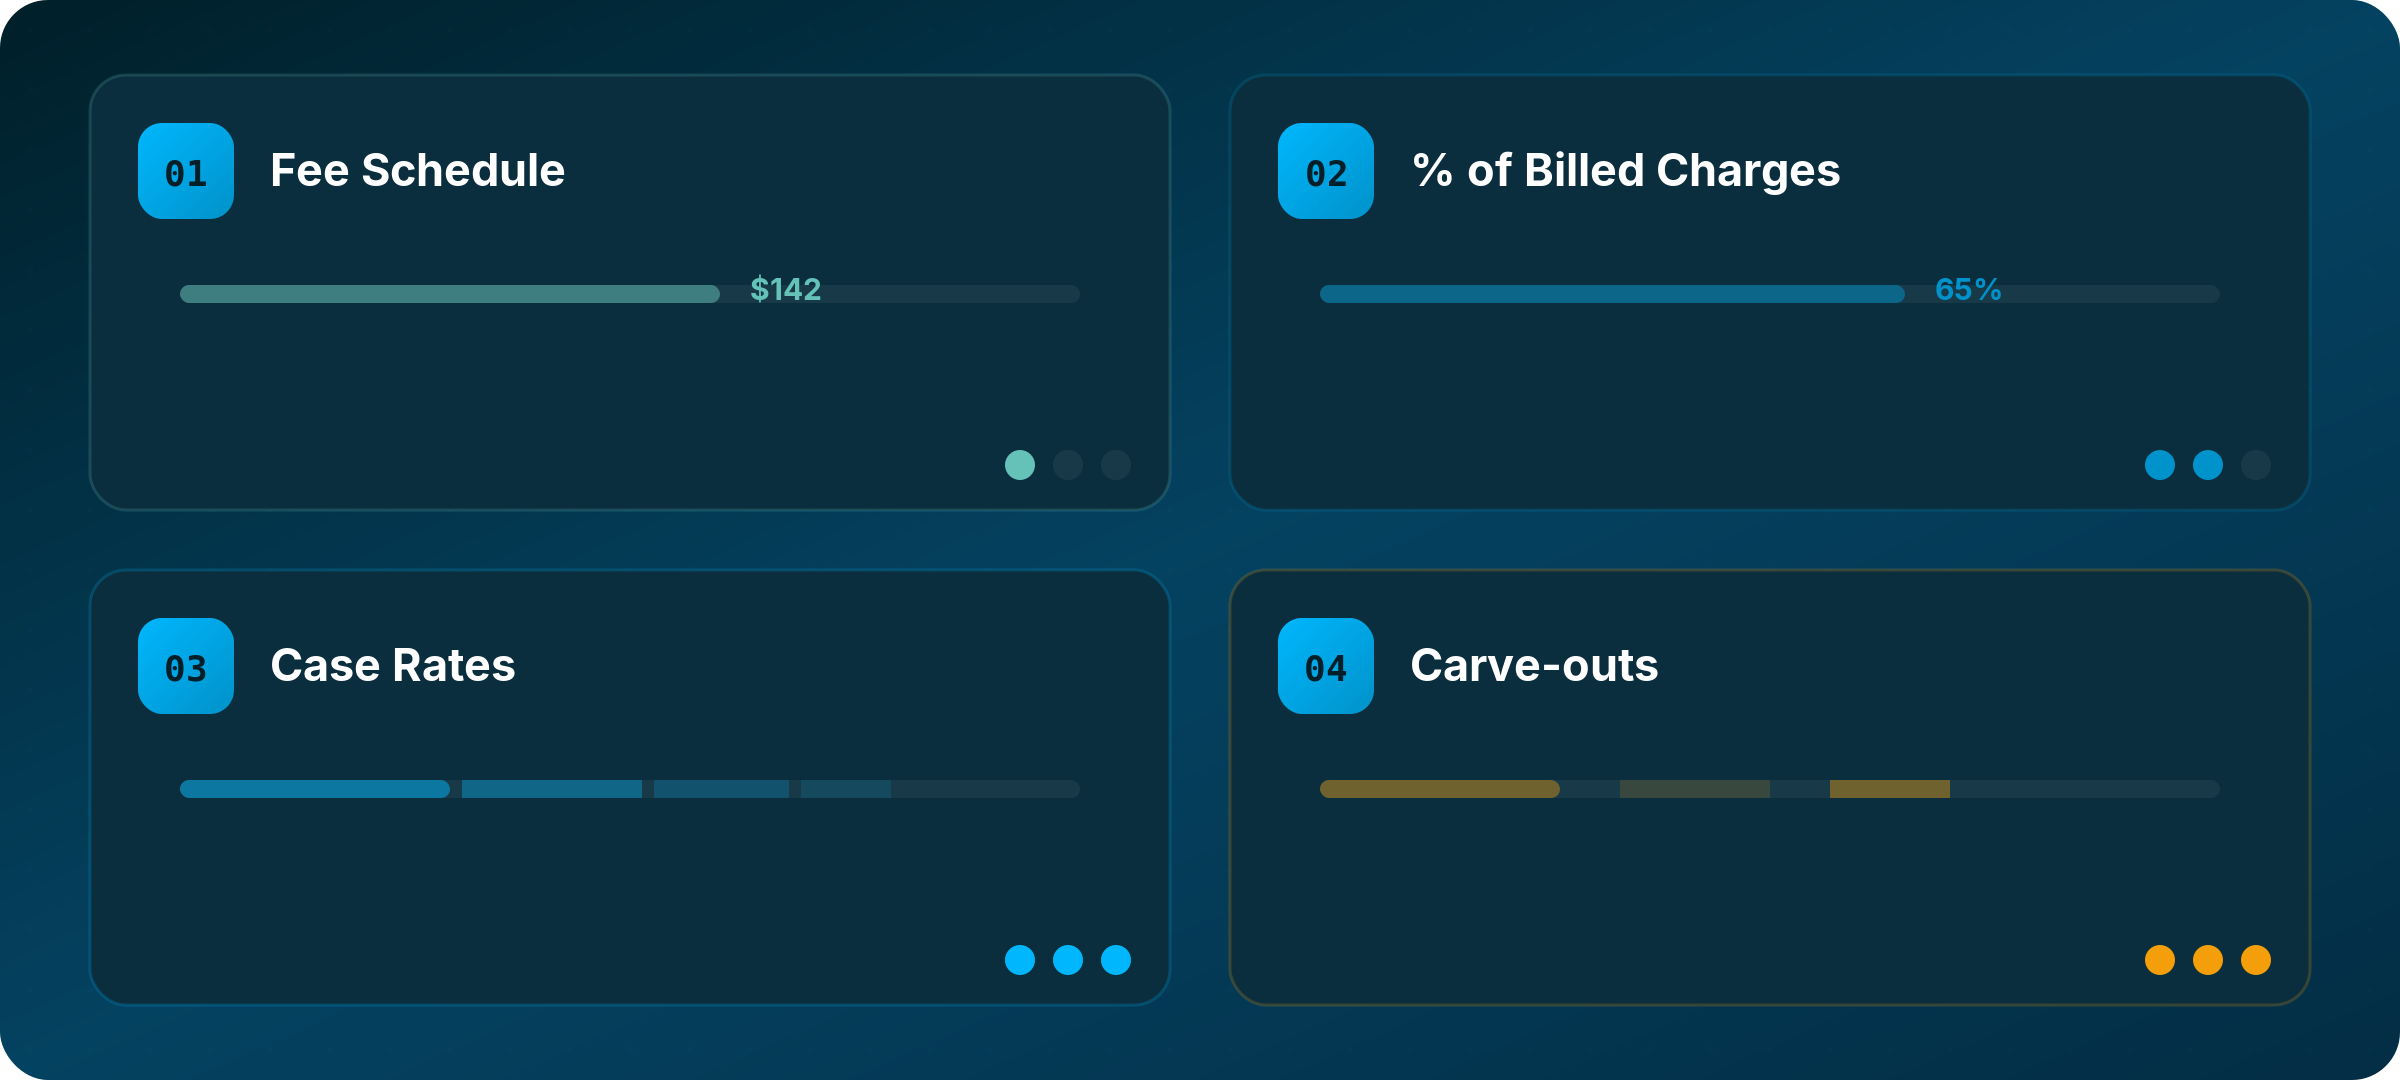
Different contract structures, at the billing code level, require different analytical approaches, and making a small error can skew your entire comparison.
Fee schedules and specific negotiated rates are the simplest to work with. The payer MRF shows a dollar amount for each code, and you can compare directly across organizations. This shows up as “Fee Schedule” and “Negotiated” in the MRF data under the Negotiated Type field in the TiC Schema.
Percent of billed charges are more complex. The MRF shows a percentage, but you need to know what the hospital actually charges to calculate expected reimbursement. This may require claims data and hospital MRFs to estimate typical charge amounts for that organization and code combination. Even then, it will be an estimate at best to truly understand the dollar impact.
Case rates and bundles require understanding the scope of what is included in each payment. An ambulatory surgery center might receive one payment covering the facility fee, surgeon fee, anesthesia, and implants, while a hospital bills those components separately. Comparing them requires knowing what is inside each rate.
Carve-outs for high-cost items like implants, specialty drugs, or transplant services are often reimbursed separately from standard rates. Missing these can dramatically skew an analysis, particularly for service lines where carved-out items represent a significant share of total revenue. These can be classified as CSTM codes in the data, Revenue Codes (RC), or under classifications that aren’t used as commonly such as an AP-DRG.
In practice, most sophisticated contracts are hybrid structures that combine several of these approaches. Knowing which structure applies to which codes is a prerequisite for any meaningful comparison.
Validate with Claims Data
Transparency data tells you what rates were negotiated. Claims data tells you what actually gets paid. These do not always match.
Contractual adjustments, claim denials, bundling edits, and other factors can create real gaps between negotiated rates and actual reimbursement. When you have remittance data with sufficient volume (we look for at least 1,000 observations per code where possible), you can validate your transparency-based estimates against real-world outcomes.
If your transparency-derived estimate says a hospital should receive $500 for a code, but claims data consistently shows $350, something in the analysis needs revisiting before drawing any conclusions.
Service Type Matters
The methodology above applies broadly, but the specific approach varies significantly depending on what you are analyzing.
Emergency and acute care is highly variable by patient presentation and requires flexible bundles built around common clinical scenarios. Professional and facility components need to be analyzed and compared within their respective buckets.
Inpatient reimbursement routinely involves Medicare Severity Diagnosis Related Groups, which bundle payment for an entire stay. Analyzing these requires understanding DRG weights, base rates, outlier provisions, and any carved-out services. Case mix and severity add another layer of complexity.
Outpatient procedures are often more straightforward, particularly for ambulatory surgery centers with bundled case rates, though variation in what is included versus billed separately still requires attention.
Infusion services are dominated by drug costs, which are often reimbursed on ASP or WAC-based structures with different margins than administration codes. Biosimilar substitution and 340B program participation can significantly affect comparisons.
Physician services outside of a facility setting are generally simpler, since you are usually dealing with fee schedules without facility components. Modifier usage and place-of-service variations are still worth watching.
Caveats Worth Acknowledging
Even with the right methodology, price transparency analysis has real limits, and we think it is important to name them honestly.
Data quality varies across payers and hospitals. Some publish clean, comprehensive files. Others have gaps, formatting inconsistencies, or errors that require extra interpretation.
MRF data reflects a point in time. Contracts get renegotiated, rates change, and an analysis built on last quarter’s data may not reflect what is true today.
Not everything shows up in MRFs. Value-based incentives, quality bonuses, and other arrangements can affect total reimbursement without appearing in transparency files.
Billing practices differ. Two hospitals might deliver identical clinical services and bill them differently based on their RCM systems, coding practices, and internal processes. That affects comparability even when you use the same code bundles.
And honestly, this work is just complex. We have been doing it alongside experienced managed care professionals for years and still approach every new analysis with humility. If someone tells you this is easy or that a simple tool can handle it automatically, we would encourage some skepticism.
A Framework for Getting It Right
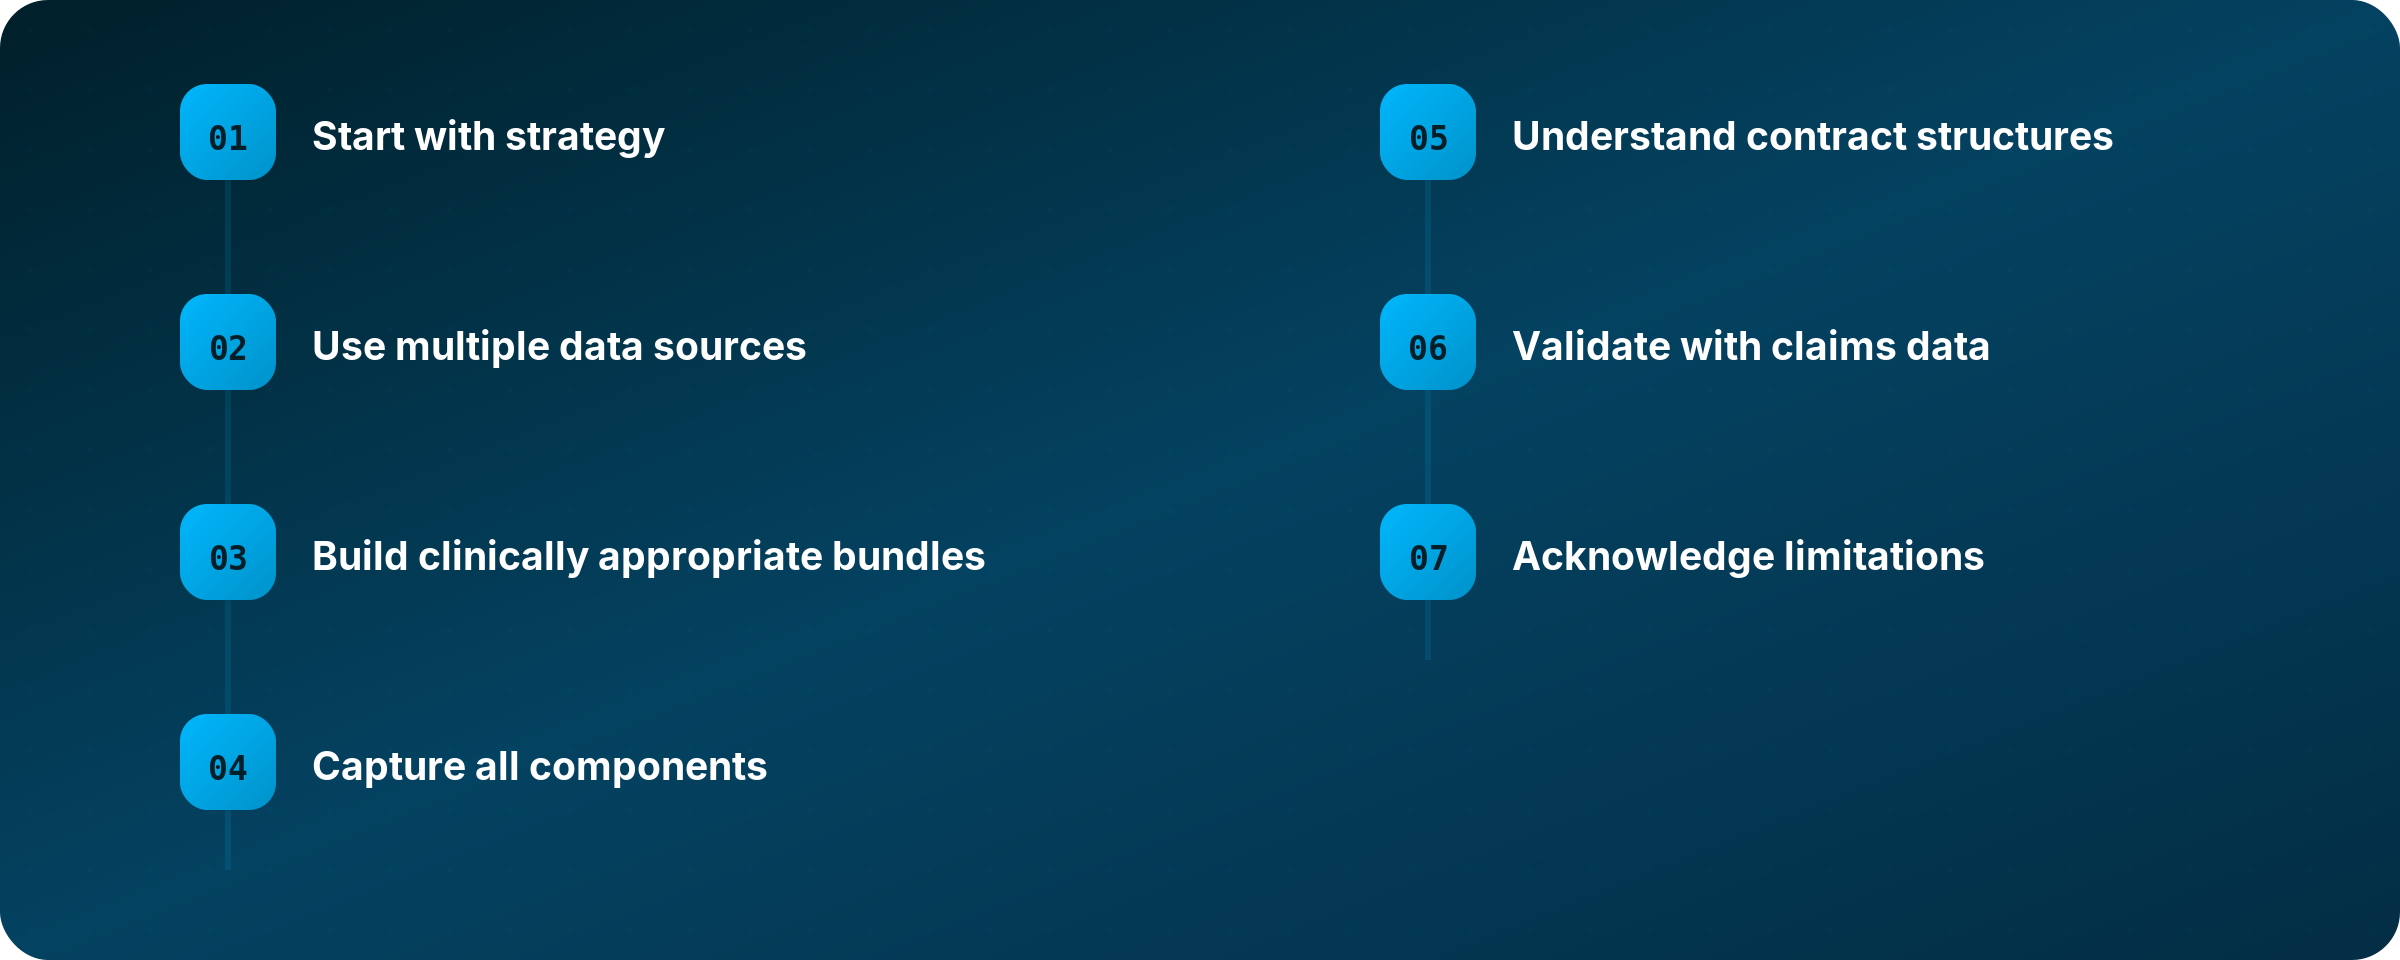
To pull it all together, here is how we approach reimbursement benchmarking using price transparency data:
Start with strategy. Know what question you are trying to answer and why it matters before you touch any data.
Use multiple data sources. Triangulate payer MRFs, hospital MRFs, and claims data. No single source is sufficient on its own.
Build clinically appropriate bundles. Never draw conclusions from single-code comparisons. Model how care is actually delivered and billed.
Capture all components. Include both professional and facility fees wherever applicable.
Understand contract structures. Know whether you are dealing with fee schedules, percent-of-charge, case rates, or hybrid arrangements, and adjust your methodology accordingly.
Validate with claims data. Use remittance data to confirm that your transparency-derived estimates reflect real-world reimbursement.
Acknowledge limitations. Be honest about what your analysis can and cannot conclude. Avoid overreach.
The Bottom Line
Price transparency data has genuine potential to shift how decisions get made in healthcare, for providers, payers, employers, and patients. But realizing that potential requires rigorous methodology and the kind of humility that comes from working closely with the data over time.
We are still early in this journey as an industry. The data will get better. The tools will improve. Enforcement will continue to develop. And we will all be better served by a community that approaches this work carefully and shares what it learns along the way.